TICK Stack Monitoring for the Non-Technical

Please note: This article originally appeared on one of my older blogs in December of 2020 and is copied here for convenience
TICK - Telegraf, Influx, Chronograf, and Kapacitor - is a method of monitoring your systems and applications. In this article, I discuss in non-technical terms what the difference is between TICK and Prometheus Grafana.
A Car Rental Advertisement
In 1962, Avis Car Rentals had a huge campaign acknowledging they were the number 2 car rental after Hertz. This campaign focused on the fact "We Try Harder" due to the fact that they were number two, and couldn't just coast. In much the same way, the dominant self-hosted observability platforms are Prometheus and Grafana, with Influx DB's TICK stack not even on the radar. So why even discuss it?
Quite frankly - they try harder at what they're good at.
What they are good at is collecting time series data in a particular format in a time-series database and then quickly lifting that into monitoring dashboards and alerting. This is not too much unlike Prometheus except for how it gathers that data and how other tools can read that data.
A Non-Technical Summary of Prometheus
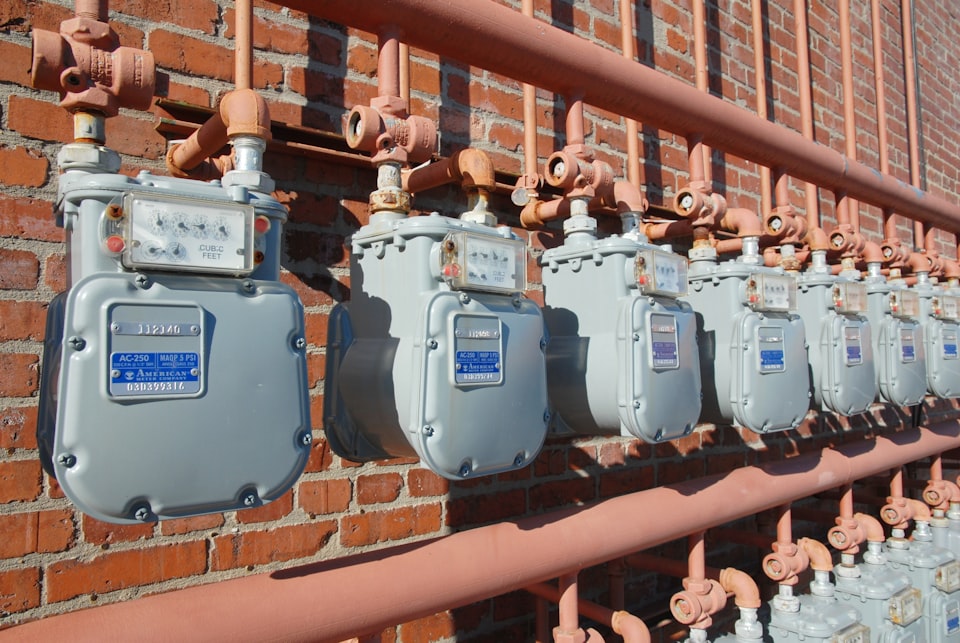
If you live in the United States you have regulated power provided either by your municipality or a local company. For instance, in Omaha, it's the Omaha Public Power District (OPPD). Every month I receive a bill telling me my energy usage - occasionally I find myself quite surprised. Did I really have the air on that much in the month that it caused a spike in cost?
How much energy you have is often read or at least confirmed by a person walking up to your meter and recording the info and moving to the next house on you block. In some cases, this is done digitally and only confirmed by the meter reader, in some places this is still a monthly activity. Every month, around the 18th, my meter is read, a bill is generated, and I receive it for payment about two weeks after the read.
Prometheus works a lot like a meter reader. Every application is a house on your block, and Prometheus goes and reads the meters it has either installed itself or presents information in a standardized and approved way to read it. It collects all these numbers, and reports them back to the central information store, and a dashboard of your usage - often in Grafana - for you to see and adjust to. However, instead of on the 18th, it does this roughly every 5 to 30 seconds, depending on configuration, presenting a "bill" on a nearly continual basis.
I, however, know it's the 18th, because I have locked gates on either side of my house and the world's most friendly Duck Tolling Retriever, Lily. In order for the meter to be read, the meter reader has to get to the gates and can peek in, but Lily also would like to greet them. What if they want to pet her? What if they have treats for her? It's important to her that she also gets attention from the person monitoring my power use.

If my power meter were back about another 6 feet, I would have to let the meter reader in on a schedule. This is where things get kind of tricky - what if I am working on a back yard project and accidentally block the gate? Or what if I am gone that day? Well, then there's rescheduling and work-arounds to accomplish.
Now, what if I could just have the meter send the readings to the power company, and never have to have someone make rounds?
Onto Telegraf
Telegraf takes the concept from sending someone to collect my meter data - or pull it, and instead has it push it to a source. There are many ways to configure Telegraf - a subject for a future blog - but it is sent encrypted across the internet to its destination in most configuration, and often at the same or similar rate to Prometheus, a common choice being every 10s.
By sending it from the power company's meter directly to the power company, it's already in the format they need to do things, like generate my bill, but it also isn't impacted by gates or lovable dogs. Indeed, my entire cul-de-sac could be gates from the main road, and no one would have to get permissions to go through the gates, because it's sending the data out.
Telegraf, when behind private networks, functions a lot the same. It can send from networks not publicly exposed to a publicly exposed endpoint, as long as you've allowed outbound data from that private network. No one needs to get into it to send your monitoring time-series data out.
However, a meter person is employed by OPPD and if they're out sick or on vacation, OPPD knows. But what if a house isn't reporting their power usage?
Kapacitor
When I got my surprise bill - a nearly 50% increase month-over-month, I first resolved to see if the meter was working. The numbers matched, and I could see that it was still cycling up pretty quickly. In a very engineer fashion, I proceeded to shut off breakers and see if it sped up or slowed down, eventually finding my HVAC breaker was the one making it climb quickly. (As an aside: Use the appropriate strength filters for your furnace. If your furnace can only use MERV 5 filters and you put a MERV 12 in it, it will have to push a lot more air to compensate)
My fear of having another extra large bill still held, so every couple of days I would check the meter, to see if it looked right. It did, and still does today, even checking it before writing this article.
However, if something is spiking or making it fall quickly, I'd rather have it tell me. In the same way, if it were pushing data to OPPD, they want to make sure it's correct and that my house is actually reporting as expected. This is what Kapacitor - the K in the TICK stack - is all about.
Kapacitor looks at the time-series data and can do a few things. It can tell if something is completely offline or online, or if it's using a certain percentage of something - for instance, am I using more than 1kW per hour. It can also use previous data to make smarter decisions, such as variance - for instance, am I using twice as much energy today as I have been for the past two weeks? Using these warning it creates, Kapacitor then can send you email, text messages, or integrate with other platforms, letting you take immediate action. By the same token, if it doesn't generate these alerts, its working as expected. It can even send the alerts multiple places - in theory to both OPPD and your cell phone.
So we know the data is working, but where does it go? And where is my bill?
InfluxDB and Chronograf
My house is sending all this nicely formatted data to the power company, but what is the power company doing? It's taking a lot of data - roughly 8,600 a day, per house. In my cul-de-sac of 7, that's just above a million readings a month. Although many modern database systems can handle a million rows of data pretty easily, they start to slow down and require a lot more maintenance. This is where a time-series database kicks in.
The data being sent to OPPD is small - likely would be just address or meter number, the time it was sampled, and the current value. Each timestamp is a new row, in this database, and since it's a series of times, you can probably gather this is where the term time-series database kicks in.
For the TICK stack, they use their own InfluxDB (The I in TICK), a time series database that is particularly well suited for this kind of information. In addition to storing it, it has ways of looking it up that are specialized and efficient for this data, letting other tools use the data readily. It can also convert data from this time-series format to a more traditional database with some effort and planning.
The final piece of the TICK stack is the Chronograf (The C in TICK), which is specialized to look at InfluxDB data and present it in a variety of dashboards and visualizations. It works closely with Kapacitor to help setup additional alerts based on the dashboards. So where you can see your dashboard - your power bill - updated regularly, it can also trigger alerts, such as when you've used a certain amount of energy.
Bringing it Together
Prometheus and Grafana are a meter reader checking your meters, installed or approved by the power company, and bringing you data back to be presented in a bill.
TICK is having your meter send the data to the power company, monitor that the meters are online, and collecting the data and presenting the bill.
This article should not be construed as one is better than another. In fact there's some crossover with what's known as the TIG stack, replacing Chronograf and Kapacitor with Grafana, and you can even hybrid Prometheus and InfluxDB into Grafana - a much more complicated task. However, being able to understand what the systems do without the jargon helps people across the technology spectrum make better, collaborative decisions.

